
Target identification via Oncolines® profiling and ResidenceTimer™
The anti-cancer agent reversine was originally identified in a phenotypic screen for molecules that can promote dedifferentiation of myoblasts into multipotent progenitor-like cells [1]. This property was attributed to its ability to inhibit Aurora B [2]. Later, it was shown that reversine can inhibit Mps1 [3]. Since then, reversine has been a popular tool compound to study the function of Mps1 in cells.
Comparative analysis via OncolinesProfiler™
To determine the mechanism of action of reversine in cells, we profiled the compound in the Oncolines® cancer cell line panel [4]. The Oncolines® panel comprises 102 human cancer cell line from diverse tumor-tissue origin. The effect of reversine on cell viability was measured using intracellular ATP as an indirect readout of cell number [5]. The compound was tested in each cell line in a nine-point dose range, in duplicate, delivering 102 values of half-maximal inhibitory potency, or IC50.
The IC50 fingerprint of reversine was compared to the fingerprints of 200 reference anticancer agents that previously have been profiled on the entire cell line panel [5,6]. The reference agent library contains both clinical and preclinical compounds, as well as tool compounds. It contains more than 30 classic cytotoxic agents, more than 120 kinase inhibitors, 4 PARP inhibitors, 5 inhibitors of BCL2-family proteins, 5 epigenetic modulators and 4 KRAS inhibitors.
The result of the comparative analysis is shown in the hierarchical clustering wheel in Figure 1. The clustering wheel displays the similarity of all compounds in the database based on their IC50 fingerprint. Accordingly, compounds that act on the same molecular target, cluster together [5,6]. Reversine clusters with a number of Mps1 kinase inhibitors (indicated in magenta). Inhibitors of Aurora B are located in a nearby, but different branch of the clustering wheel (indicated in blue). This indicates that reversine impairs cells viability primarily through inhibition of Mps1 and not Aurora kinases.
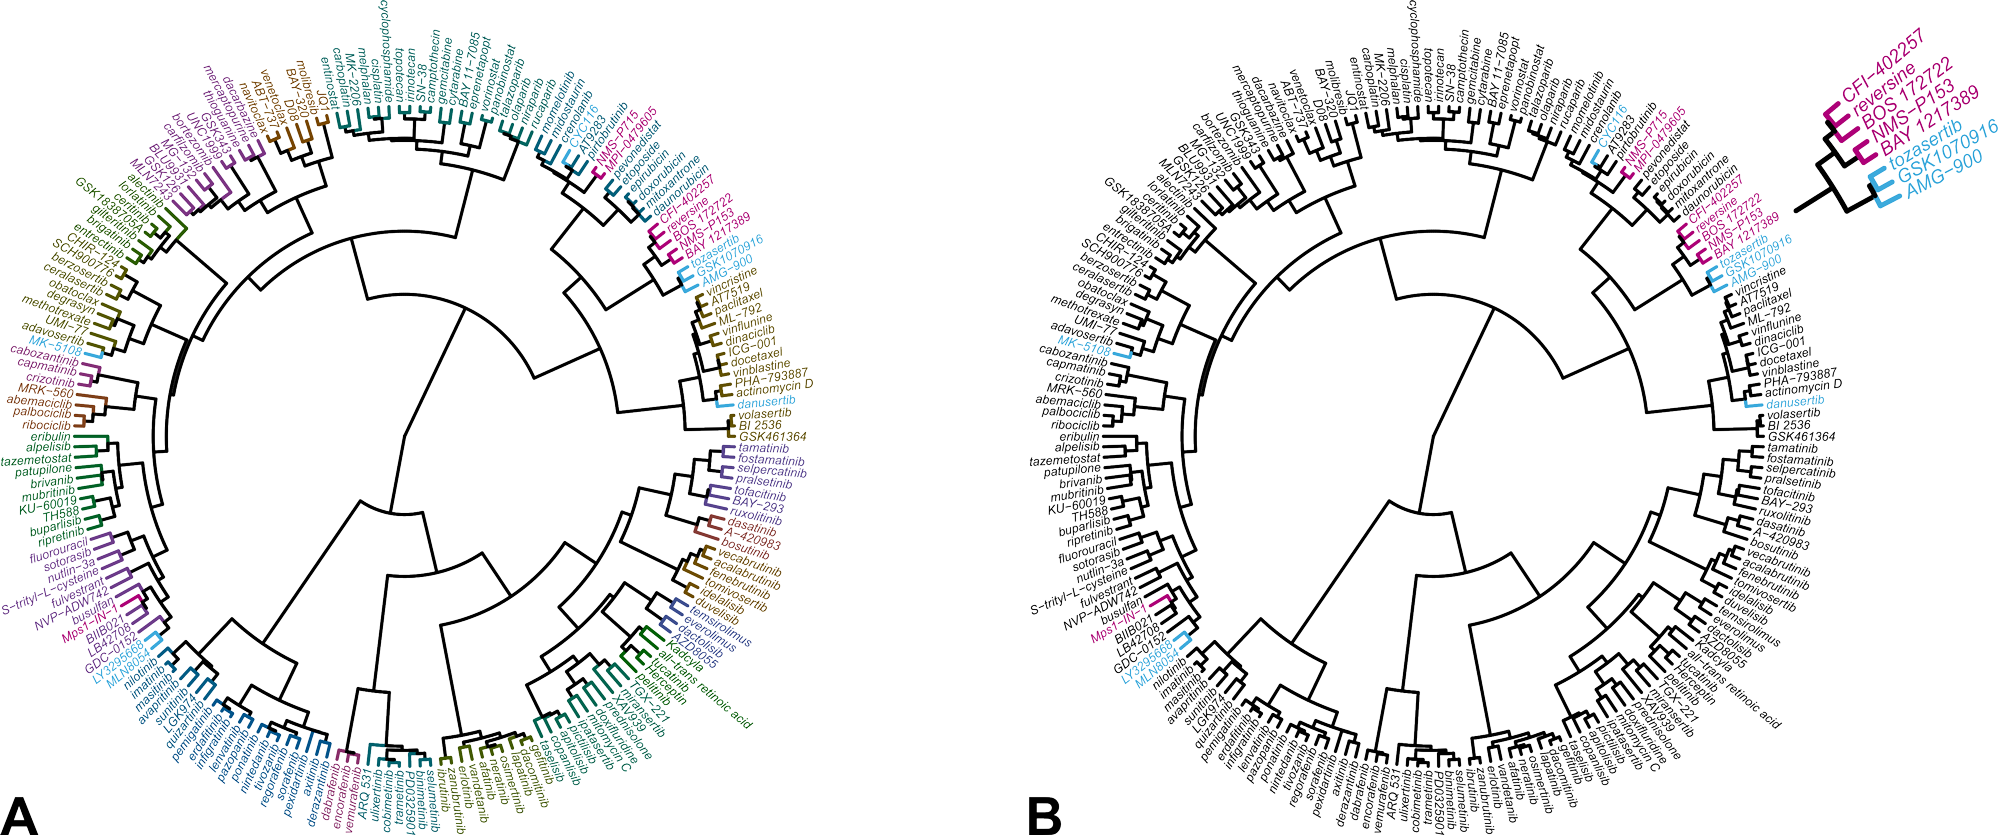
Figure 1. Hierarchical clustering of 200 reference anticancer agents based on their IC50 fingerprint in Oncolines® profiling.
(A) Each compound is assigned to one of 23 clusters, indicated with different colors. (B) Same clustering wheel highlighting the Mps1 inhibitors (magenta) and the Aurora kinase inhibitors in the library (blue). The original analysis was published in reference [4]. The analysis was repeated for this case study with an expanded data set of more anticancer agents and more cell lines.
Confirmation of target binding with ResidenceTimer™
The selectivity of reversine was further studied in binding assays using purified recombinant kinases and surface plasmon resonance (SPR) using Biacore technology (Cytiva). For SPR, the target protein is immobilized on a chip, and a solution containing the kinase inhibitor is injected and flown over the surface. Binding of a compound to the target protein changes the refractive index, which is measured as a positive signal expressed in resonance units (Figure 2). The resulting sensorgram is used to determine the association rate (ka) and dissociation rate constant (kd) of the binding reaction. The two parameters are then used to calculate the equilibrium dissociation constant (affinity) (KD) with the formula KD = kd/ka.
The kinetic constants of the binding of reversine to Mps1 and Aurora B were determined with five consecutive injections of an increasing concentration gradient of the compound. This results in five peaks as shown in the sensorgrams in Figure 2. ka is determined from the shape of these peaks using Biacore software. Next, buffer without reversine is floated over the surface, resulting in dissociation of reversine from the target protein. kd is determined from this second part of the sensorgram.
Overlay of the two sensorgrams in Figure 2 indicates that reversine binds faster to Mps1 than to Aurora B. It also shows that reversine dissociates slower from Mps1 than from Aurora B. Indeed, comparison of the two KD values revealed that reversine has a 800 times higher affinity (lower KD) for Mps1 than for Aurora B. These experiments confirm that reversine is an inhibitor of Mps1, although it also shows some low cross-reactivity with Aurora B. However, it is safe to conclude that the cellular effects seen with reversine, such as in the original phenotypic screen, are primarily through its binding to Mps1.

Figure 2. Overlay of SPR sensorgrams of reversine binding to Mps1 and Aurora B, and equilibrium dissociation constants determined from the fitted graphs using Biacore software. The arrows at the bottom of the figure indicate the five consecutive injections of reversine, whereas the arrow at the top indicates the start of the dissociation phase.
References
[1] Chen et al. (2007) Reversine increases the plasticity of lineage-committed mammalian cells. Proceeding of the National Academy of Sciences, 104 (25):10482-7.
[2] d’Alise et al. (2008) Reversine, a novel Aurora kinase inhibitor, inhibits colony formation of human acute myeloid leukemia cells. Molecular Cancer Therapeutics, 7 (5):1140-9.
[3] Santaguida et al. (2010) Dissecting the role of Mps1 in chromosome biorientation and the spindle checkpoint through the small molecule inhibitor reversine. The Journal of Cell Biology, 190 (1):73-87.
[4] Libouban et al. (2018) Stable aneuploid tumor cells are more sensitive to TTK inhibition than chromosomally unstable cell lines. Oncotarget, 8 (24):38309-25.
[5] Kooijman et al. (2022) Comparative kinase and cancer cell panel profiling of kinase inhibitors approved for clinical use from 2018 to 2020. Frontiers in Oncology, 12:953013.
[6] Uitdehaag et al. (2016) Cell panel profiling reveals conserved therapeutic clusters and differentiates the mechanism of action of different PI3K/mTOR, Aurora kinase and EZH2 inhibitors. Molecular Cancer Therapeutics, 15 (12):3097-109.
[7] Willemsen-Seegers et al. (2017) Compound selectivity and target residence time of kinase inhibitors studied with surface plasmon resonance. Journal of Molecular Biology, 429:574-86.