
Broad Kinase Screening Panels
QuickScout™
Kinase Activity Screening
Selectivity of Your Compounds
QuickScout™ allows rapid and accurate determination of the selectivity of your compounds. The screening panels range from a full kinase panel comprising more than 300 kinase enzyme assays to focused panels such as the tyrosine kinase (TK) panel, the serine/threonine kinase (STK) panel, and the cell cycle panel. All of these panels are run with rapid turnaround time. The kinase profiling platform QuickScout™ is offered through our partner Carna Biosciences, Inc.

Kinase Profiling at Physiological ATP Level
Despite the sensitivity of in vitro assays at ATP concentrations approximating KM, physiological conditions are seldom the same. Inhibitory potency and selectivity may vary with the concentration of ATP available. The impact of ATP concentration on kinase inhibitory activity can be assessed by measurements at [ATP] = KM, ATP and [ATP] = 1 mM. Kinase screening at 1 mM is available for roughly 200 kinases. Please contact us for the list of kinases that can be screened at 1 mM or have a look at the table of kinases.
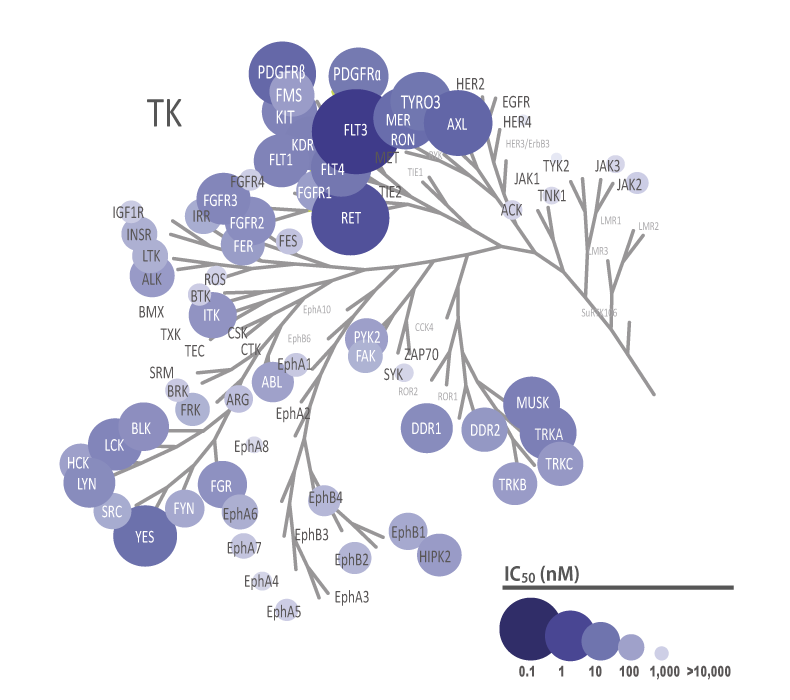
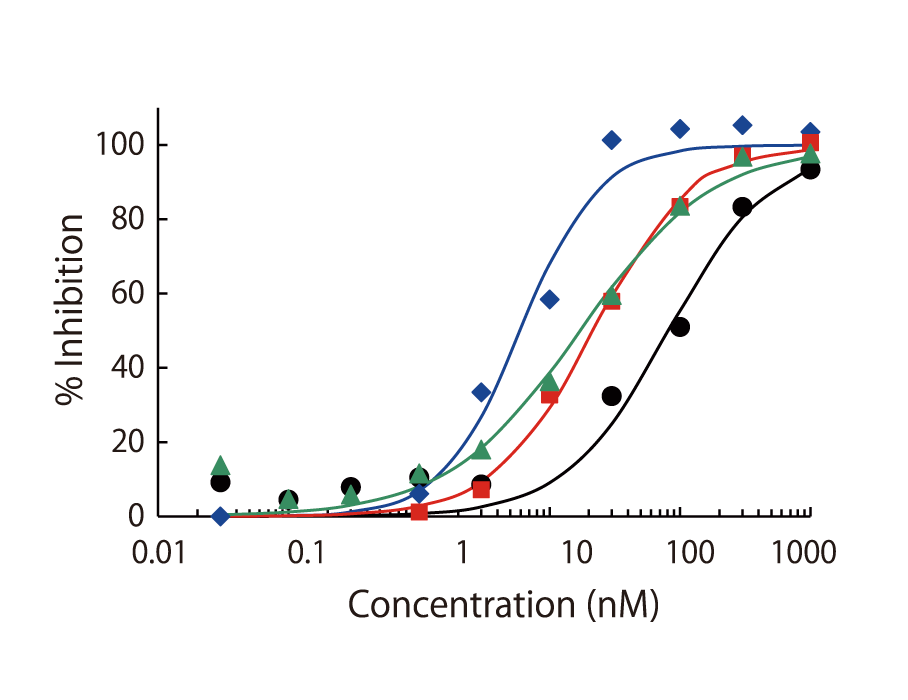
Inhibtion of tyrosine kinases by sunitinib at [ATP] = KM, bin
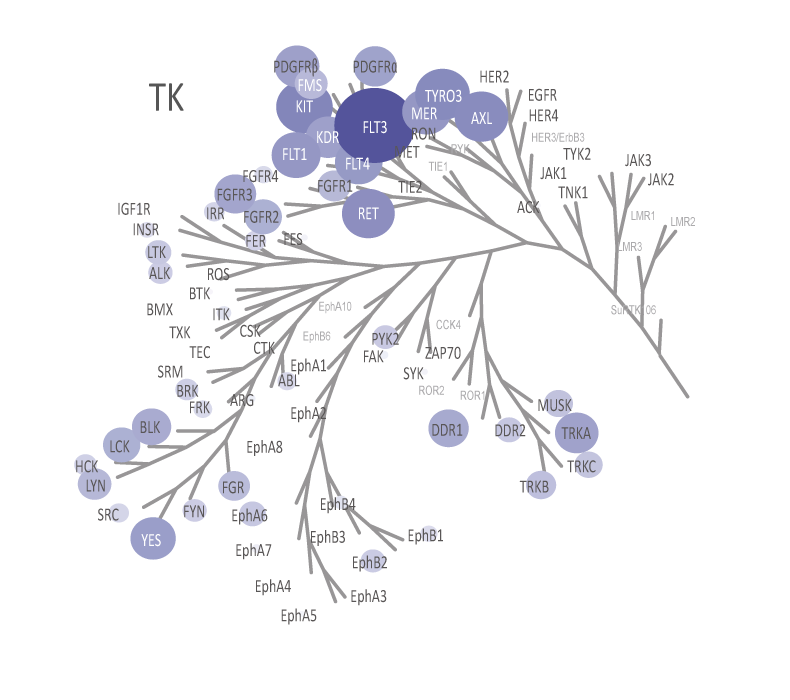
Inhibition of tyrosine kinases by sunitinib at [ATP] = 1 mM
Preincubation for Slow Binders
Certain classes of kinase inhibitors exhibit slow binding kinetics because of their mechanistic behaviour. For such compounds, pre-incubation is necessary to assess their real maximal effect. QuickScout™ provides the option of kinase inhibition assays with a pre-incubation step. The preincubation service is available for 170 kinases. The kinases for the preincubation service can be found in the table of kinases or can be requested here.
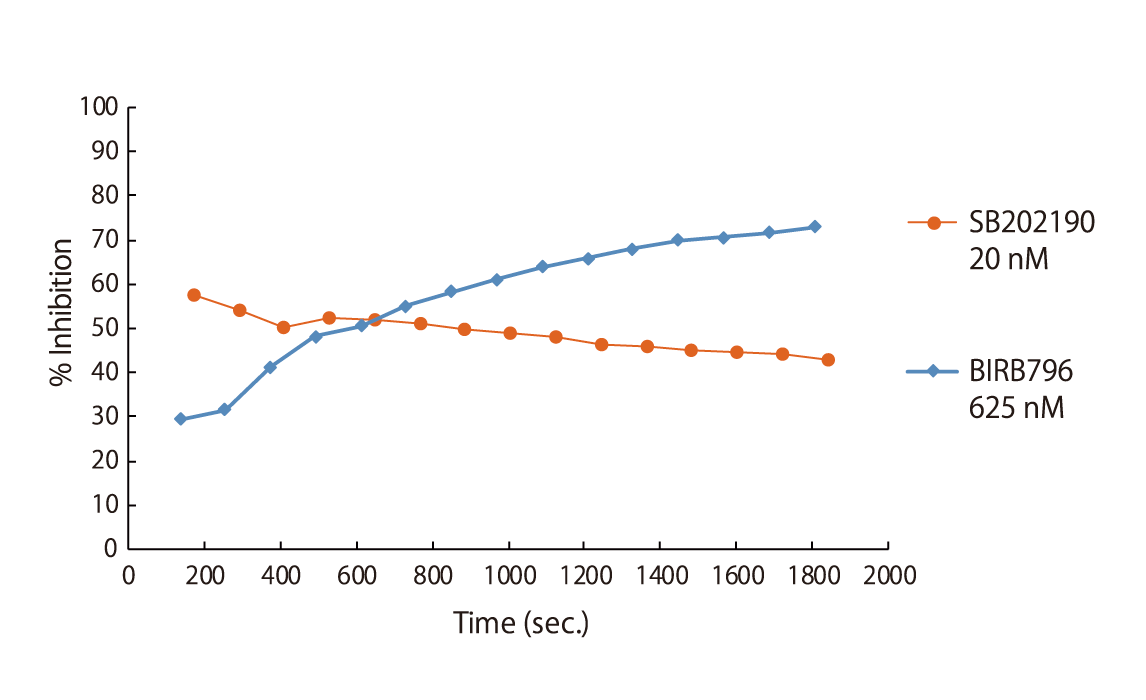
Time course of the p38α inhibitors SB202190 and BIRB796. BIRB796 induces a slow conformational change that locks the protein into an inactive conformation. Therefore, the potency of BIRB796 increases with the period of incubation.
| Effect of pre-incubation on IC50 (nM) | ||
| with pre-incubation | without pre-incubation | |
| BIRB796 | 9.5 ( |
82 ( |
| SB202190 | 19 ( |
22 ( |
IC50 comparison with and without pre-incubation for p38α inhibitors SB202190 and BIRB796. The difference in IC50 for BIRB796 is a factor 8.6.
Low Limit of Detection
The theoretical lower limit of detection to reliably determine IC50 values in enzyme assays is approximately half of the enzyme concentration. The enzyme concentration in all QuickScout™ assays is below 10 nM. The table on the right shows examples for FGFR enzymes. Note: This calculation is based on the total enzyme concentration, not taking into account the fraction of total enzyme that is active and the purity of the enzyme preparation.
| Enzyme concentration | Limit of detection | |
| FGFR1 | 0.27 nM | 0.14 nM |
| FGFR2 | 0.17 nM | 0.08 nM |
| FGFR3 | 0.27 nM | 0.14 nM |
| FGFR4 | 6.0 nM | 3.0 nM |
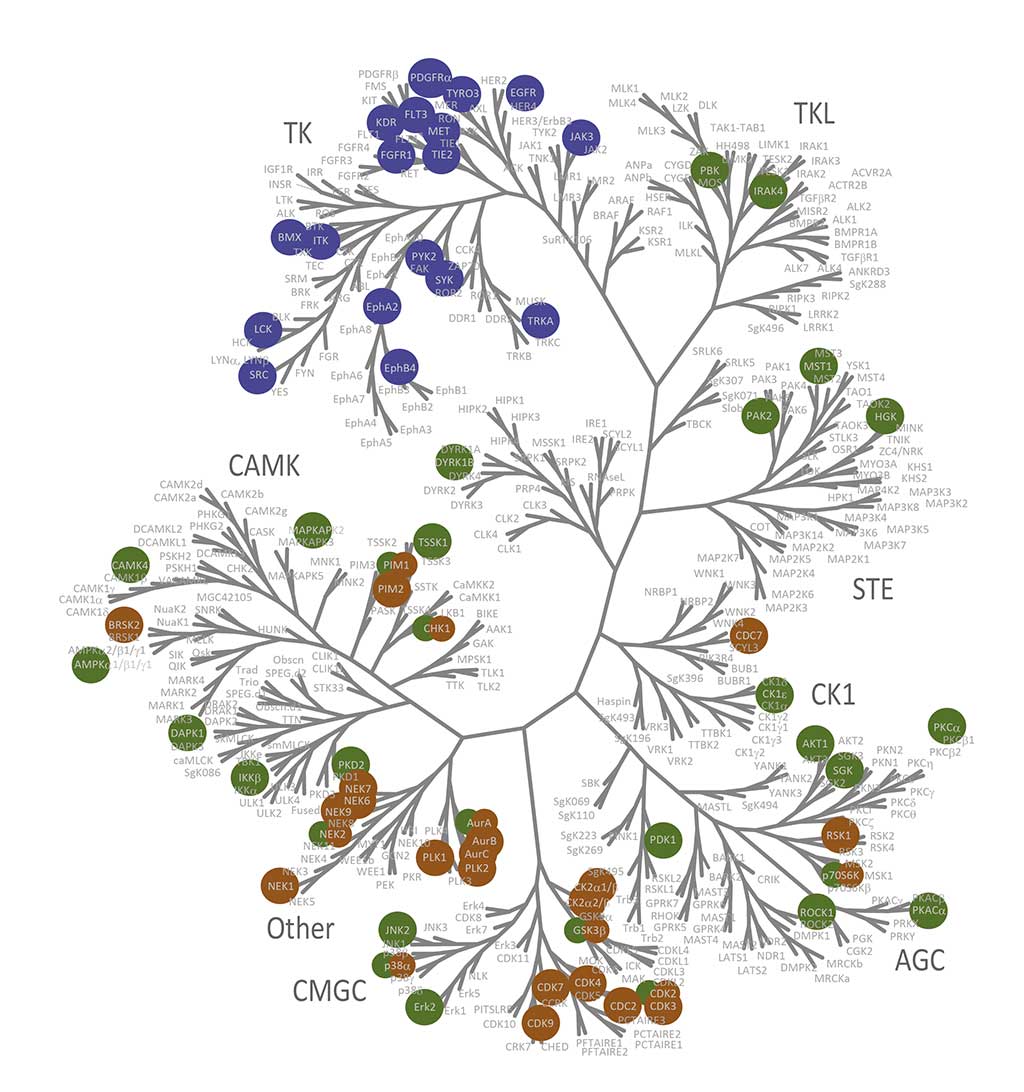
Quantification of Selectivity
Selectivity of your compounds can be quantified by calculation of the selectivity entropies. Selectivity entropies are calculated from the percent inhibition values and measured IC50 values (Uitdehaag and Zaman, 2011). Selectivity entropy is a quantitative, single-value expression of the selectivity of compounds. It allows comparison of relative selectivity based on data from large pharmacological profiling experiments. Selectivity entropy is expressed as Ssel. The lower this value, the more selective a compound.
Uitdehaag et al. (2019) provides examples of the implications of quantifying selectivity, for instance, for the BTK inhibitors acalabrutinib and ibrutinib. Acalabrutinib is the most selective of the two inhibitors, with Ssel = 1.4 for acalabrutinib and Ssel = 2.4 for ibrutinib. This is also reflected in its cell panel profile. Acalabrutinib only inhibits one cell line, whereas ibrutinib inhibits the proliferation of eight cell lines. MEK inhibitor cobimetinib was shown to have a very low selectivity entropy (Ssel = 0.8), which was explained by its selectivity for MEK1 and MEK2, with only additional activity on MEKK1. This is due to its unique type III allosteric binding mode, which it shares with trametinib. Both drugs partially inhibit BRAF and RAF1 at 1 mM, which could contribute to their efficacy.
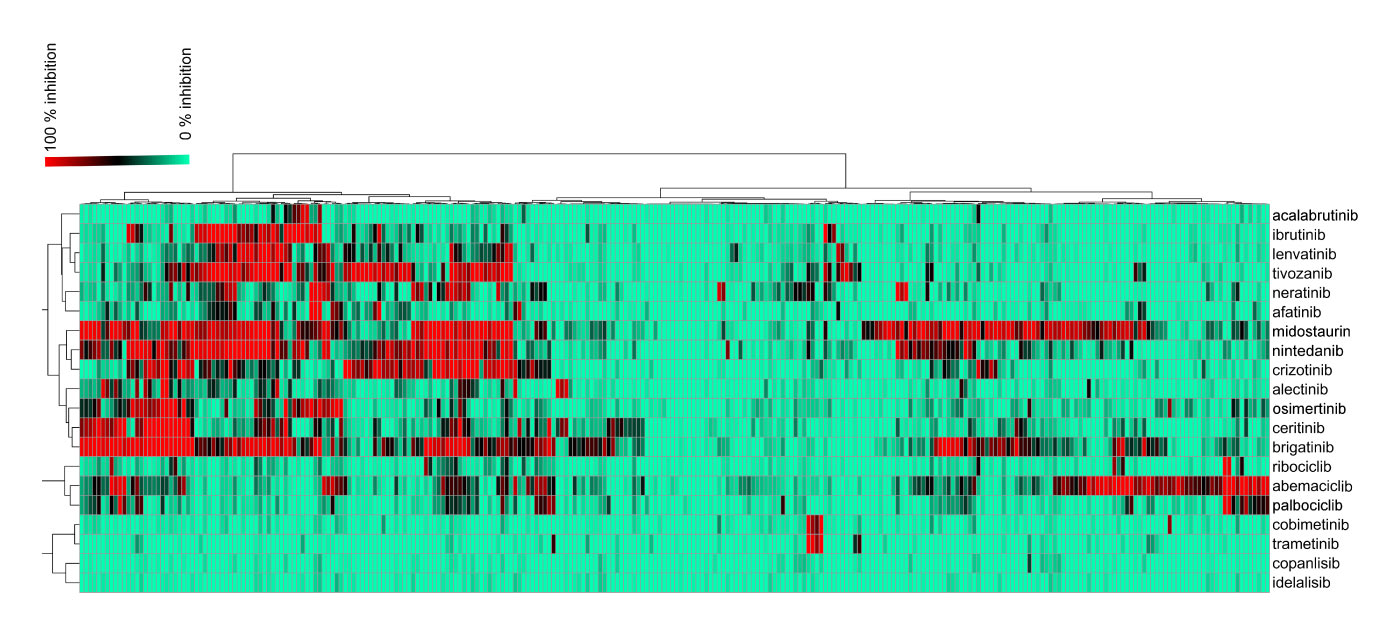
Visualization of biochemical selectivity via Ward-based clustering of biochemical inhibition profiles of 17 new inhibitors on 280 wild-type protein kinases (Uitdehaag et al., 2019)
Combination of Biochemical Profiling and Cell-Based Studies
Combination of the cellular and biochemical data sets of kinase inhibitors reveals that improved biochemical potency correlates with improved cellular IC50 values, and the strength of this correlation is target-dependent (Uitdehaag et al., 2014). Overall, cell panel profiling in combination with biochemical panel profiling can be a powerful tool in finding new applications for existing inhibitors and the design of optimally targeted inhibitors.
References
Uitdehaag & Zaman (2011) A theoretical entropy score as a single value to express inhibitor selectivity. BMC Bioinformatics 12:94.
Uitdehaag et al. (2014) Comparison of the cancer gene targeting and biochemical selectivities of all targeted kinase inhibitors approved for clinical use. PLoS ONE, 9 (3):e92146.
Uitdehaag et al. (2019) Combined cellular and biochemical profiling to identify predictive drug response biomarkers for kinase inhibitors approved for clinical use between 2013 and 2017. Molecular Cancer Therapeutics, 18 (2):470-481.
Kooijman et al. (2022) Comparative kinase and cancer cell panel profiling of kinase inhibitors approved for clinical use from 2018 to 2020. Frontiers in Oncology, 12:953013.