
ResidenceTimer™ Surface Plasmon Resonance (SPR) Using Biacore
Determination of Drug-Target Interaction
Differentiation of Drug Candidates by Binding Characteristics
Determination of target residence time may help you to differentiate your drug candidate from competitor compounds. Drugs that reside on their target for several hours will have the advantage that their pharmacodynamic effect will last even after the drug has been eliminated from systemic circulation. Our profiling service via ResidenceTimer™ gives a mechanistic rationale for the distinct pharmacological features of a drug candidate compared to another.
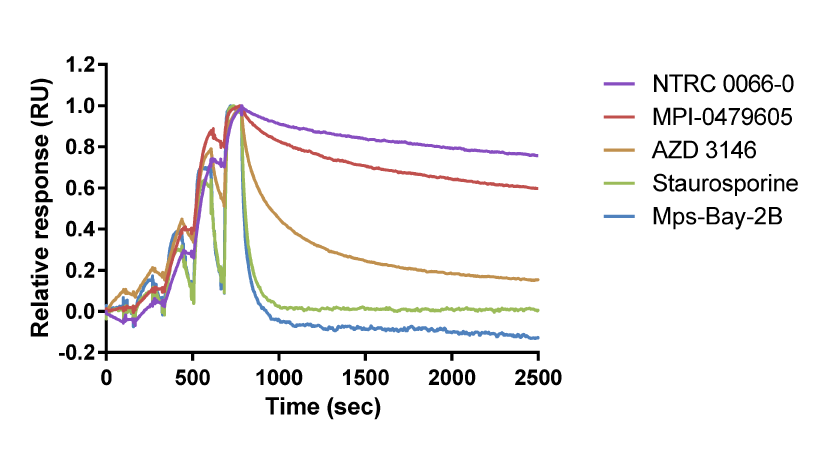
Above, right: Overlay of binding curves for TTK inhibitors. In this chart, NTRC 0066-0 binds to TTK with the longest target residence time. Staurosporine and Mps-Bay-2B have a short residence time on TTK (adapted from Maia et al., 2015).
Below, right: Binding parameters for TTK inhibitors on TTK.
| Compound | ka (M-1 s-1) | kd (s-1) | KD (M) | t1/2 (s) |
| NTRC 0066-0 | 5.1E+05 | 2.2E-04 | 4.3E-10 | 3185 |
| AZD 3146 | 3.5E+07 | 1.8E-01 | 5.0E-09 | 4 |
| MPI-0479605 | 1.6E+06 | 9.7E-04 | 5.9E-10 | 718 |
| Mps-Bay-2B | 2.2E+06 | 2.2E-02 | 1.0E-08 | 31 |
| Staurosporine | 6.7E+05 | 1.6E-02 | 2.5E-08 | 42 |
Selectivity Within a Family of Targets
Kinetic selectivity for an isoform within a family of kinases can guide the selection of drug candidates for further studies. Using SPR binding analysis, it was shown that the PI3K-γ/δ inhibitor duvelisib binds to PI3K-δ and PI3K-γ with relatively long target residence time. The PI3K-δ inhibitor idelalisib is selective for PI3K-δ with a longer residence time and higher on-rate than for the other isoforms of PI3K. The pan-PI3K inhibitor buparlisib is not selective for a specific isoform.
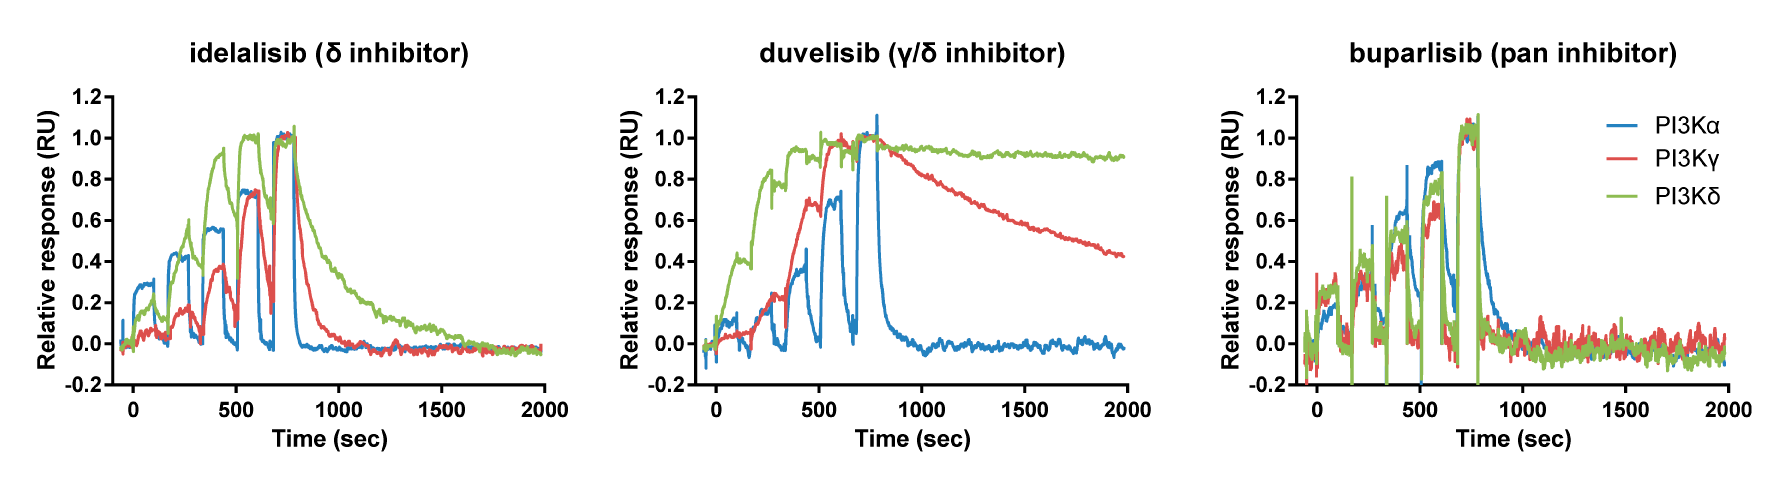
Binding curve overlays for the inhibitors idelalisib (PI3K-δ inhibitor), duvelisib (PI3K-γ/δ inhibitor) and buparlisib (pan-PI3K inhibitor) (Willemsen-Seegers et al., 2017)
SPR and Cell-Based Data Together Provide a Hypothesis on the Mechanism of Action In Vivo
The pharmacological behaviour of selective PI3K inhibitors was confirmed in cell-based assays. Selective and pan-PI3K inhibitors were profiled in the cancer cell line panel Oncolines® via proliferation assays. The IC50 fingerprints of the PI3K inhibitors (over the full panel) were compared to the IC50 fingerprints of 120 anticancer agents. As part of the comparative analysis, compounds with similar IC50 fingerprints were clustered. The clustering showed that selective PI3K inhibitors cluster separately from pan-PI3K inhibitors (Uitdehaag et al., 2016).

Oncolines® network tree of PI3K inhibitors. Connections are drawn between compounds with a defined correlation. Only compounds within two connections of the investigated compounds (red) are shown (Uitdehaag et al., 2016). The network tree shows that the PI3K inhibitors are separated into two clusters, the first containing alpelisib, buparlisib, pictilisib, and apitolisib, the second containing duvelisib, idelalisib, and TGX-221. Interestingly, buparlisib, the most advanced pan-PI3K inhibitor in the clinic (Dienstmann et al., 2014) shows correlation with a substantial number of profiles of non-PI3K inhibitors.
Distinction by On- and Off-Rates
Compounds may have similar affinity for a target while the association and dissociation rates of the drugs can differ. The figure below shows Aurora inhibitors with similar affinities for Aurora A and Aurora B (Willemsen-Seegers et al., 2017). Practically all inhibitors have affinities between 1 and 10 nM. Despite the comparable affinities, the figure shows that the association and dissociation kinetics of the compounds on Aurora A and B are clearly distinctive. The pan-Aurora inhibitor danusertib has similar affinity for Aurora A and B as shown in the table, while it has a 14-fold lower dissociation rate for Aurora B. This means that danusertib has much longer target residence time on Aurora B than Aurora A. In this context, it should also be noted that danusertib behaves as an Aurora B inhibitor in cell-based assays (Carpinelli et al., 2007). Especially for compounds of which the target residence time measurement exceeds the half-life in circulation, kinetic selectivity is more predictive for in vivo effect than determining selectivity on the basis of IC50 or KD.
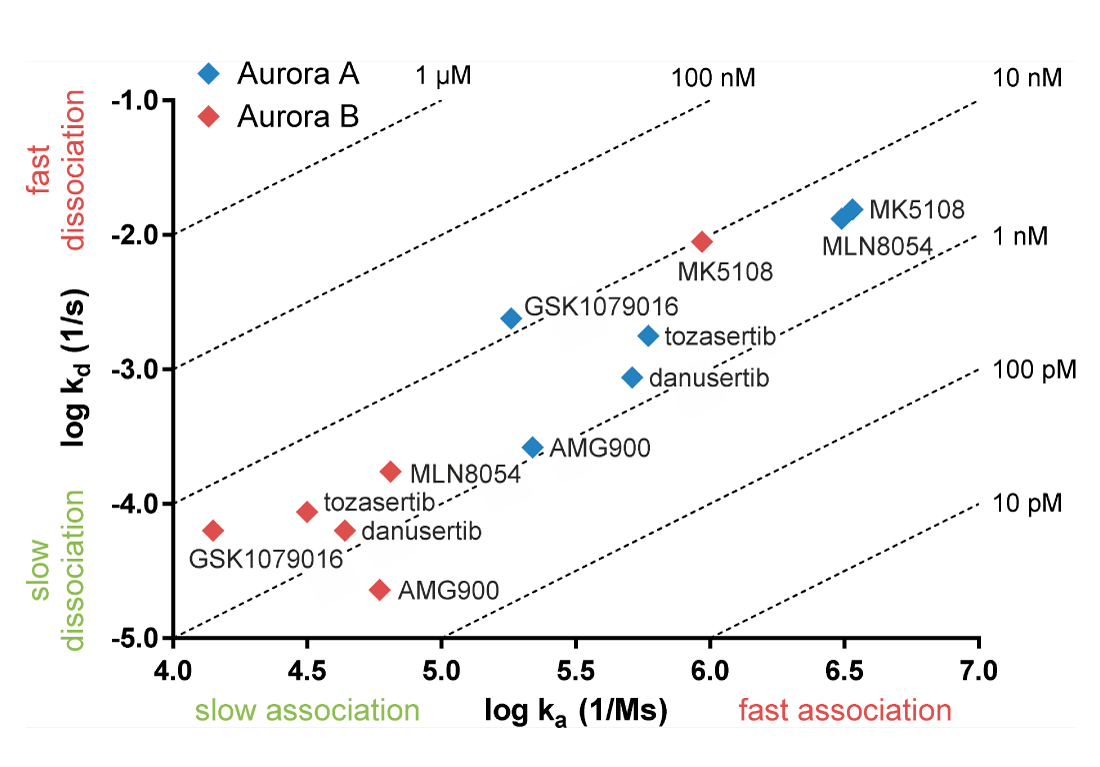
| danusertib | KD (M) | kd (s-1) |
| Aurora A | 1.69E-09 | 8.68E-04 |
| Aurora B | 1.44E-09 | 6.26E-05 |
Left: Plot of association rate (x-axis) and dissociation rate (y-axis) of Aurora kinase inhibitors. Dotted lines refer to equilibrium affinity constants (KD) calculated from the on- and off rates (Willemsen-Seegers et al., 2017).
Above: Affinity and dissociation rate of danusertib on Aurora A and B. Kinetic constants are averages of logarithmic values.
References
Maia et al. (2015) Inhibition of the spindle assembly checkpoint kinase TTK enhances the efficacy of docetaxel in a triple-negative breast cancer model. Annals of Oncology, 26 (10):2180-2192.
Willemsen-Seegers et al. (2017) Compound Selectivity and Target Residence Time of Kinase Inhibitors Studied with Surface Plasmon Resonance. Journal of Molecular Biology, 429:574-586.
Uitdehaag et al. (2016) Cell Panel Profiling Reveals Conserved Therapeutic Clusters and Differentiates the Mechanism of Action of Different PI3K/mTOR, Aurora Kinase and EZH2 Inhibitors. Molecular Cancer Therapeutics, 15 (12):3097-3109.
Dienstmann et al. (2014) Picking the point of inhibition: a comparative review of PI3K/AKT/mTOR pathway inhibitors. Molecular Cancer Therapeutics, 13 (5):1021-1031.
Carpinelli et al. (2007) PHA-739358, a potent inhibitor of Aurora kinases with a selective target inhibition profile relevant to cancer. Molecular Cancer Therapeutics, 6 (12):3158-3168.
